Plot venn diagram as a ggplot layer object. It supports only data frame as input.
Source:R/geom_venn.R
geom_venn.RdPlot venn diagram as a ggplot layer object. It supports only data frame as input.
Usage
geom_venn(
  mapping = NULL,
  data = NULL,
  stat = "identity",
  position = "identity",
  ...,
  set_names = NULL,
  element_column = NULL,
  show_elements = FALSE,
  show_set_totals = "none",
  show_stats = c("cp", "c", "p"),
  show_counts = TRUE,
  show_percentage = TRUE,
  digits = 1,
  label_sep = ",",
  count_column = NULL,
  show_outside = c("auto", "none", "always"),
  auto_scale = FALSE,
  fill_color = default_color_list,
  fill_alpha = 0.5,
  stroke_color = "black",
  stroke_alpha = 1,
  stroke_size = 1,
  stroke_linetype = "solid",
  set_name_color = "black",
  set_name_size = 6,
  text_color = "black",
  text_size = 4,
  comma_sep = FALSE,
  padding = 0.2,
  max_elements = 6,
  text_truncate = TRUE
)
Arguments
- mapping
Set of aesthetic mappings created by
aes(). If specified andinherit.aes = TRUE(the default), it is combined with the default mapping at the top level of the plot. You must supplymappingif there is no plot mapping.- data
A data.frame or a list as input data.
- stat
The statistical transformation to use on the data for this layer, as a string.
- position
A position adjustment to use on the data for this layer. This can be used in various ways, including to prevent overplotting and improving the display. The
positionargument accepts the following:The result of calling a position function, such as
position_jitter(). This method allows for passing extra arguments to the position.A string naming the position adjustment. To give the position as a string, strip the function name of the
position_prefix. For example, to useposition_jitter(), give the position as"jitter".For more information and other ways to specify the position, see the layer position documentation.
- ...
Other arguments passed on to
layer()'sparamsargument. These arguments broadly fall into one of 4 categories below. Notably, further arguments to thepositionargument, or aesthetics that are required can not be passed through.... Unknown arguments that are not part of the 4 categories below are ignored.Static aesthetics that are not mapped to a scale, but are at a fixed value and apply to the layer as a whole. For example,
colour = "red"orlinewidth = 3. The geom's documentation has an Aesthetics section that lists the available options. The 'required' aesthetics cannot be passed on to theparams. Please note that while passing unmapped aesthetics as vectors is technically possible, the order and required length is not guaranteed to be parallel to the input data.When constructing a layer using a
stat_*()function, the...argument can be used to pass on parameters to thegeompart of the layer. An example of this isstat_density(geom = "area", outline.type = "both"). The geom's documentation lists which parameters it can accept.Inversely, when constructing a layer using a
geom_*()function, the...argument can be used to pass on parameters to thestatpart of the layer. An example of this isgeom_area(stat = "density", adjust = 0.5). The stat's documentation lists which parameters it can accept.The
key_glyphargument oflayer()may also be passed on through.... This can be one of the functions described as key glyphs, to change the display of the layer in the legend.
- set_names
Set names, use column names if omitted.
- element_column
A single character value use as column name to select elements.
- show_elements
Show set elements instead of count/percentage.
- show_set_totals
Show total count (c) and/or percentage (p) for each set. Pass a string like "cp" to show both. Any other string like "none" to hide both.
- show_stats
Show count (c) and/or percentage (p) for each set. Pass a string like "cp" to show both.
- show_counts
Show count for each set.
- show_percentage
Show percentage for each set.
- digits
The desired number of digits after the decimal point.
- label_sep
Separator character for displaying elements.
- count_column
Specify column for element repeat count.
- show_outside
Show outside elements (not belongs to any set). Options: "auto", "none", "always".
- auto_scale
Allow automatically resizing circles according to element counts (only for 2-set diagrams).
- fill_color
Filling colors in circles. Can be a single color or a vector of colors for each set.
- fill_alpha
Transparency for filling circles. Can be a single value or a vector for each set.
- stroke_color
Stroke color for drawing circles. Can be a single color or a vector of colors for each set.
- stroke_alpha
Transparency for drawing circles. Can be a single value or a vector for each set.
- stroke_size
Stroke size for drawing circles. Can be a single value or a vector for each set.
- stroke_linetype
Line type for drawing circles. Can be a single value or a vector for each set.
- set_name_color
Text color for set names.
- set_name_size
Text size for set names.
- text_color
Text color for intersect contents.
- text_size
Text size for intersect contents.
- comma_sep
Whether to use comma as separator for displaying numbers.
- padding
Padding for the plot. Change this to allow longer labels to be displayed.
- max_elements
Maximum number of elements to display when show_elements=TRUE.
- text_truncate
Whether to truncate text when elements exceed max_elements.
Examples
library(ggvenn)
# use data.frame as input
d <- dplyr::tibble(
value = c(1, 2, 3, 5, 6, 7, 8, 9),
`Set 1` = c(TRUE, FALSE, TRUE, TRUE, FALSE, TRUE, FALSE, TRUE),
`Set 2` = c(TRUE, FALSE, FALSE, TRUE, FALSE, FALSE, FALSE, TRUE),
`Set 3` = c(TRUE, TRUE, FALSE, FALSE, FALSE, FALSE, TRUE, TRUE),
`Set 4` = c(FALSE, FALSE, FALSE, FALSE, TRUE, TRUE, FALSE, FALSE)
)
# ggplot gramma
ggplot(d) +
geom_venn(aes(A = `Set 1`, B = `Set 2`)) +
coord_fixed() +
theme_void()
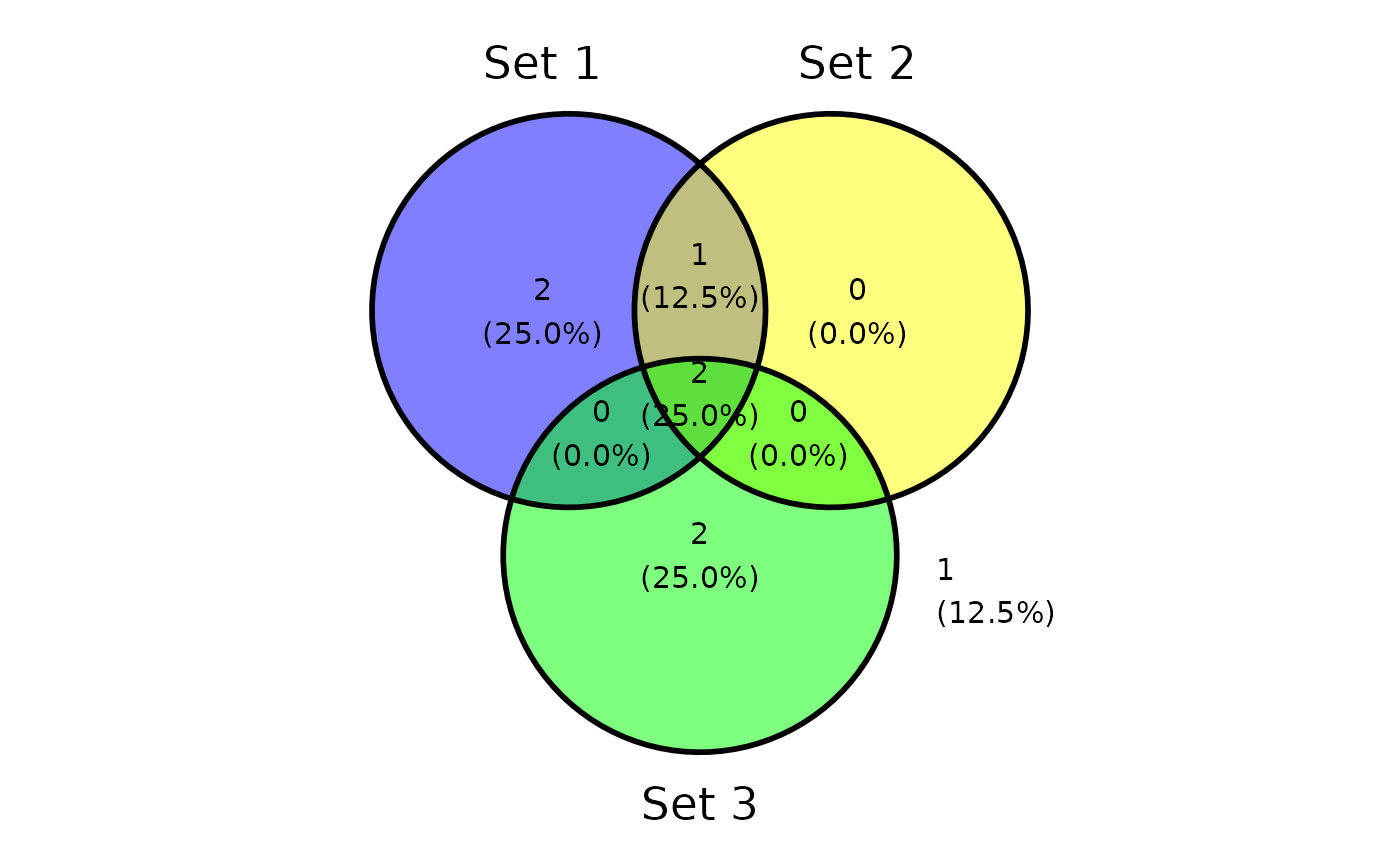
 ggplot(d) +
geom_venn(aes(A = `Set 1`, B = `Set 2`, C = `Set 3`)) +
coord_fixed() +
theme_void()
ggplot(d) +
geom_venn(aes(A = `Set 1`, B = `Set 2`, C = `Set 3`)) +
coord_fixed() +
theme_void()
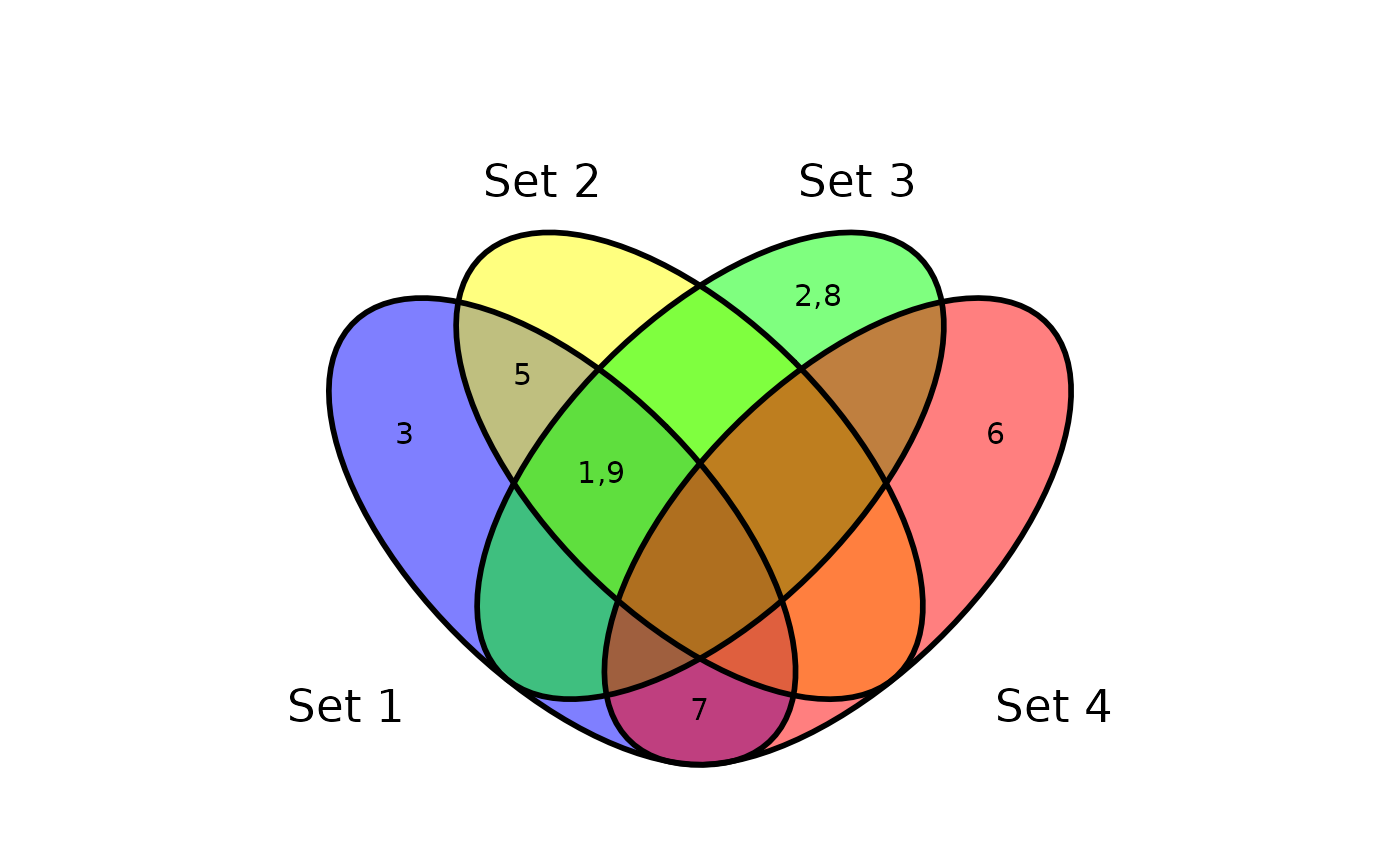
 ggplot(d) +
geom_venn(aes(A = `Set 1`, B = `Set 2`, C = `Set 3`, D = `Set 4`)) +
coord_fixed() +
theme_void()
ggplot(d) +
geom_venn(aes(A = `Set 1`, B = `Set 2`, C = `Set 3`, D = `Set 4`)) +
coord_fixed() +
theme_void()
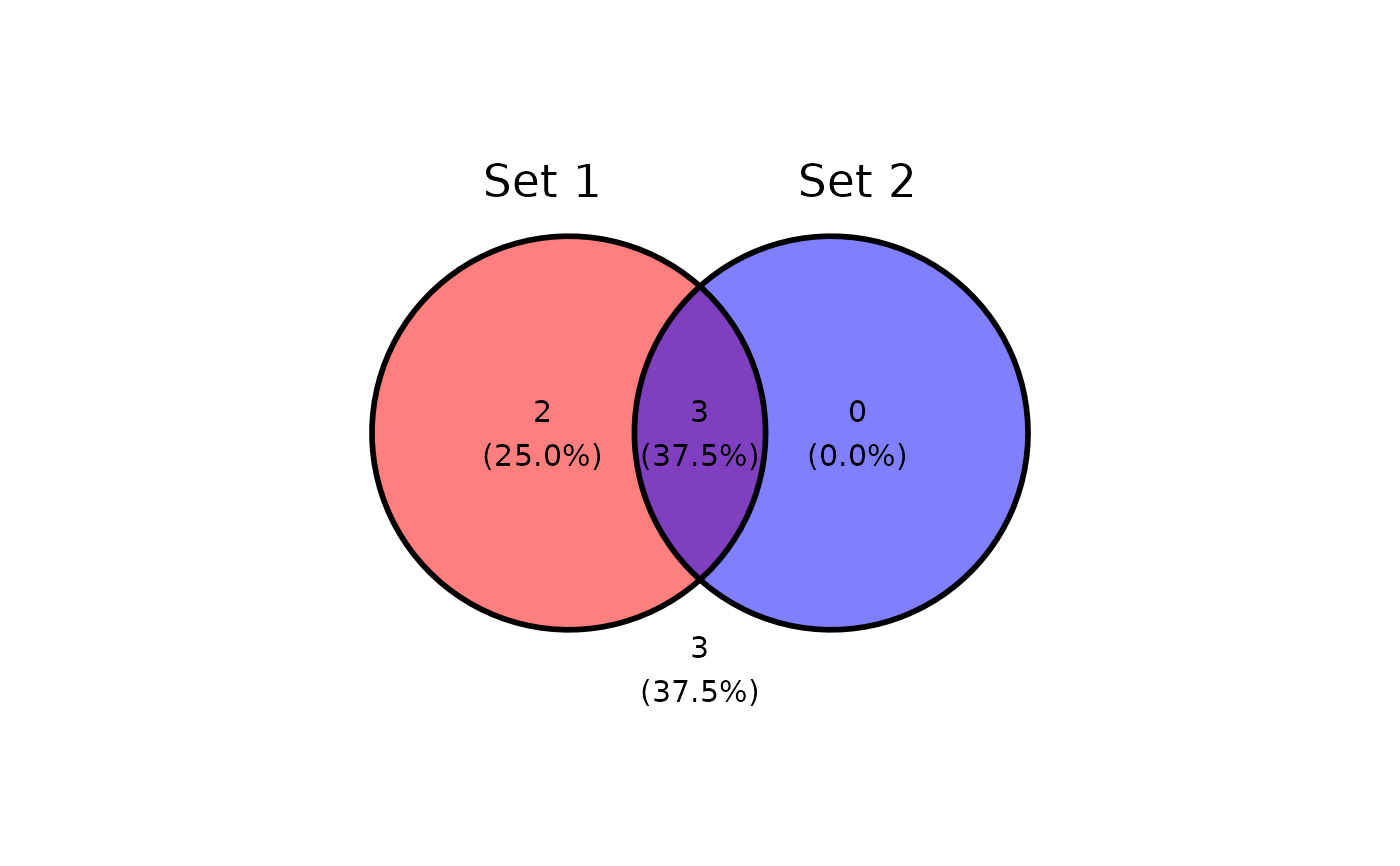
 # set fill color
ggplot(d) +
geom_venn(aes(A = `Set 1`, B = `Set 2`), fill_color = c("red", "blue")) +
coord_fixed() +
theme_void()
# set fill color
ggplot(d) +
geom_venn(aes(A = `Set 1`, B = `Set 2`), fill_color = c("red", "blue")) +
coord_fixed() +
theme_void()
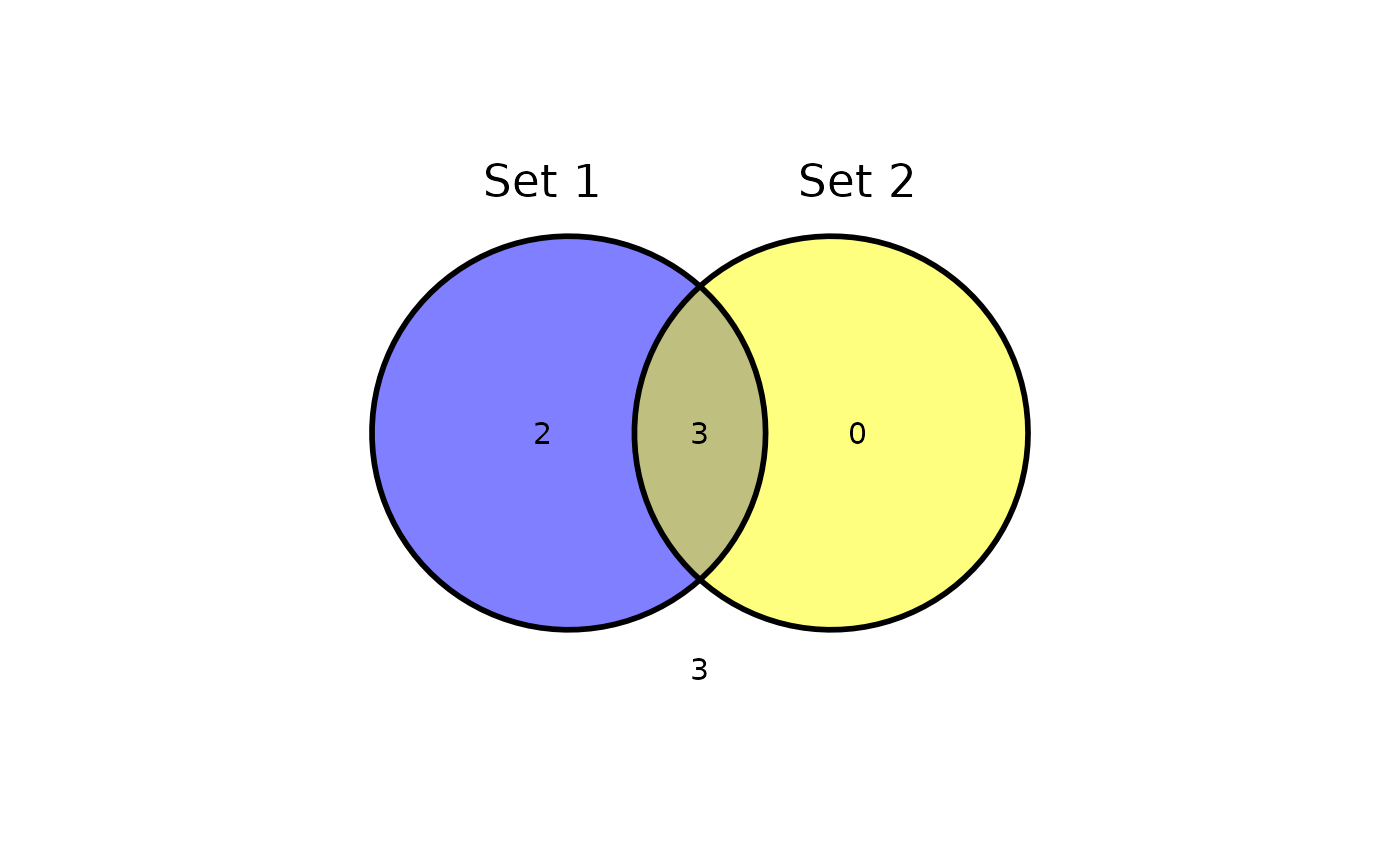
 # hide percentage
ggplot(d) +
geom_venn(aes(A = `Set 1`, B = `Set 2`), show_stats = "c") +
coord_fixed() +
theme_void()
# hide percentage
ggplot(d) +
geom_venn(aes(A = `Set 1`, B = `Set 2`), show_stats = "c") +
coord_fixed() +
theme_void()
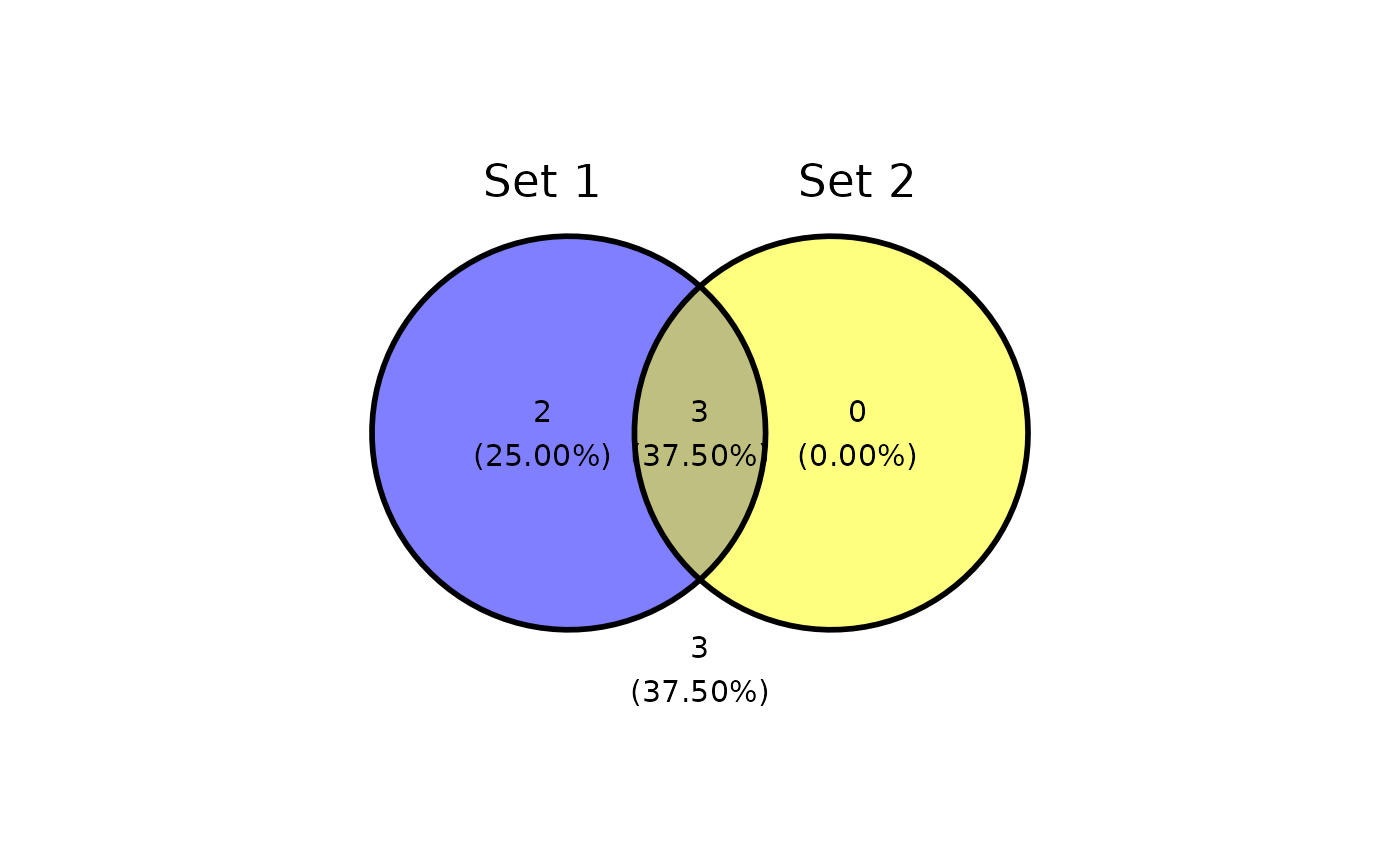
 # change precision of percentages
ggplot(d) +
geom_venn(aes(A = `Set 1`, B = `Set 2`), digits = 2) +
coord_fixed() +
theme_void()
# change precision of percentages
ggplot(d) +
geom_venn(aes(A = `Set 1`, B = `Set 2`), digits = 2) +
coord_fixed() +
theme_void()
 # show elements instead of count/percentage
ggplot(d) +
geom_venn(aes(A = `Set 1`, B = `Set 2`, C = `Set 3`, D = `Set 4`, label = value)) +
coord_fixed() +
theme_void()
# show elements instead of count/percentage
ggplot(d) +
geom_venn(aes(A = `Set 1`, B = `Set 2`, C = `Set 3`, D = `Set 4`, label = value)) +
coord_fixed() +
theme_void()