Plot venn diagram as an independent function. It supports both data frame and list as input.
Source:R/ggvenn.R
ggvenn.RdPlot venn diagram as an independent function. It supports both data frame and list as input.
Usage
ggvenn(
  data,
  columns = NULL,
  element_column = NULL,
  show_elements = FALSE,
  show_set_totals = "none",
  show_stats = c("cp", "c", "p"),
  show_counts = TRUE,
  show_percentage = TRUE,
  digits = 1,
  label_sep = ",",
  count_column = NULL,
  show_outside = c("auto", "none", "always"),
  auto_scale = FALSE,
  fill_color = default_color_list,
  fill_alpha = 0.5,
  stroke_color = "black",
  stroke_alpha = 1,
  stroke_size = 1,
  stroke_linetype = "solid",
  set_name_color = "black",
  set_name_size = 6,
  text_color = "black",
  text_size = 4,
  comma_sep = FALSE,
  padding = 0.2,
  max_elements = 6,
  text_truncate = TRUE
)
Arguments
- data
A data.frame or a list as input data.
- columns
A character vector use as index to select columns/elements.
- element_column
A single character value use as column name to select elements. It is only allowed when data is a data.frame.
- show_elements
Show set elements instead of count/percentage.
- show_set_totals
Show total count (c) and/or percentage (p) for each set. Pass a string like "cp" to show both. Any other string like "none" to hide both.
- show_stats
Show count (c) and/or percentage (p) for each set. Pass a string like "cp" to show both. Any other string like "none" to hide both.
- show_counts
Show count for each set.
- show_percentage
Show percentage for each set.
- digits
The desired number of digits after the decimal point.
- label_sep
Separator character for displaying elements.
- count_column
Specify column for element repeat count.
- show_outside
Show outside elements (not belongs to any set). Options: "auto", "none", "always".
- auto_scale
Allow automatically resizing circles according to element counts (only for 2-set diagrams).
- fill_color
Filling colors in circles. Can be a single color or a vector of colors for each set.
- fill_alpha
Transparency for filling circles. Can be a single value or a vector for each set.
- stroke_color
Stroke color for drawing circles. Can be a single color or a vector of colors for each set.
- stroke_alpha
Transparency for drawing circles. Can be a single value or a vector for each set.
- stroke_size
Stroke size for drawing circles. Can be a single value or a vector for each set.
- stroke_linetype
Line type for drawing circles. Can be a single value or a vector for each set.
- set_name_color
Text color for set names.
- set_name_size
Text size for set names.
- text_color
Text color for intersect contents.
- text_size
Text size for intersect contents.
- comma_sep
Whether to use comma as separator for displaying numbers.
- padding
Padding for the plot. Change this to allow longer labels to be displayed.
- max_elements
Maximum number of elements to display when show_elements=TRUE.
- text_truncate
Whether to truncate text when elements exceed max_elements.
Examples
library(ggvenn)
# use list as input
a <- list(A = 1:5, B = 4:9, C = c(2:3, 8:12), D = c(1, 5, 9))
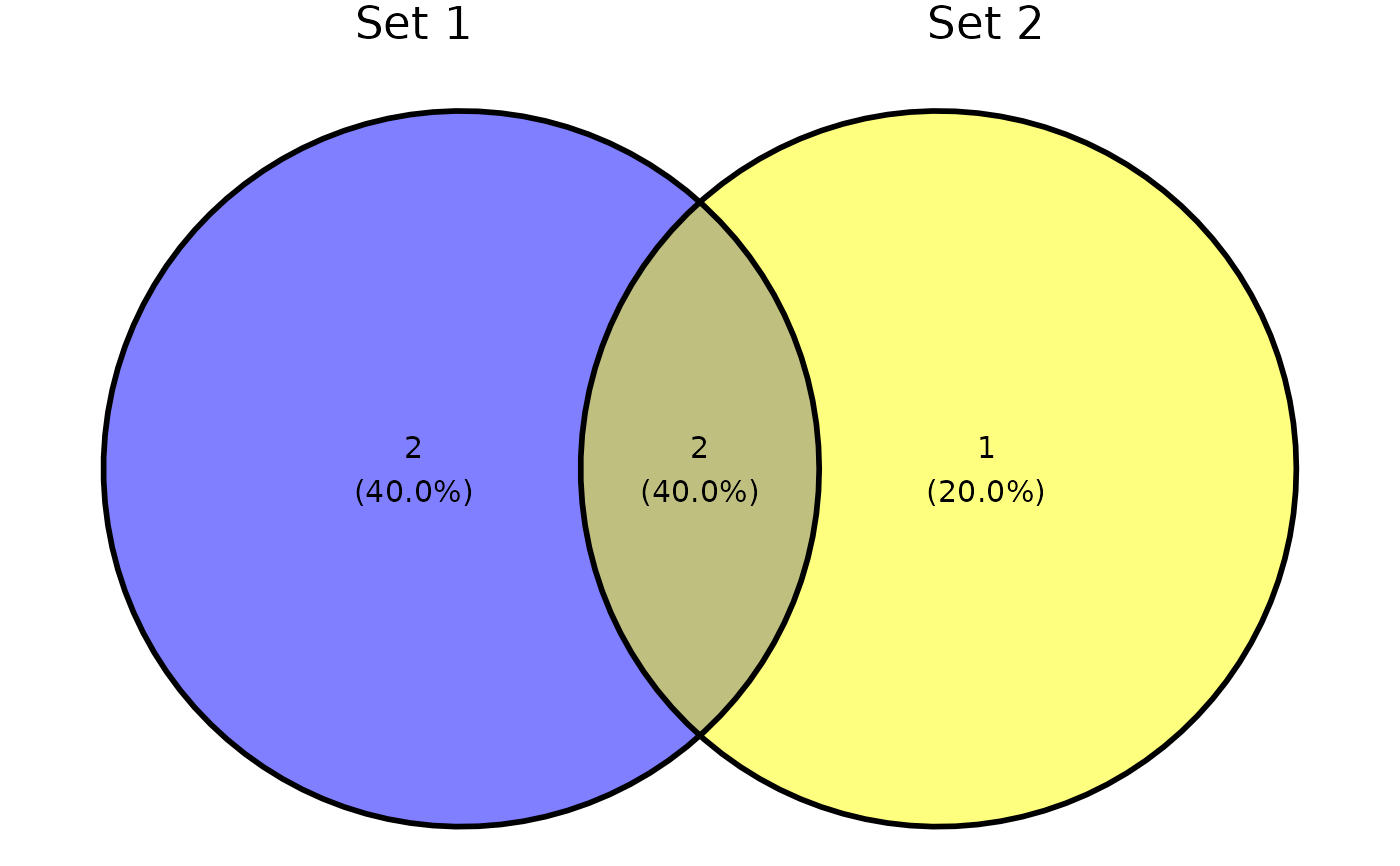
ggvenn(a, c("A", "B"))
 ggvenn(a, c("A", "B", "C"))
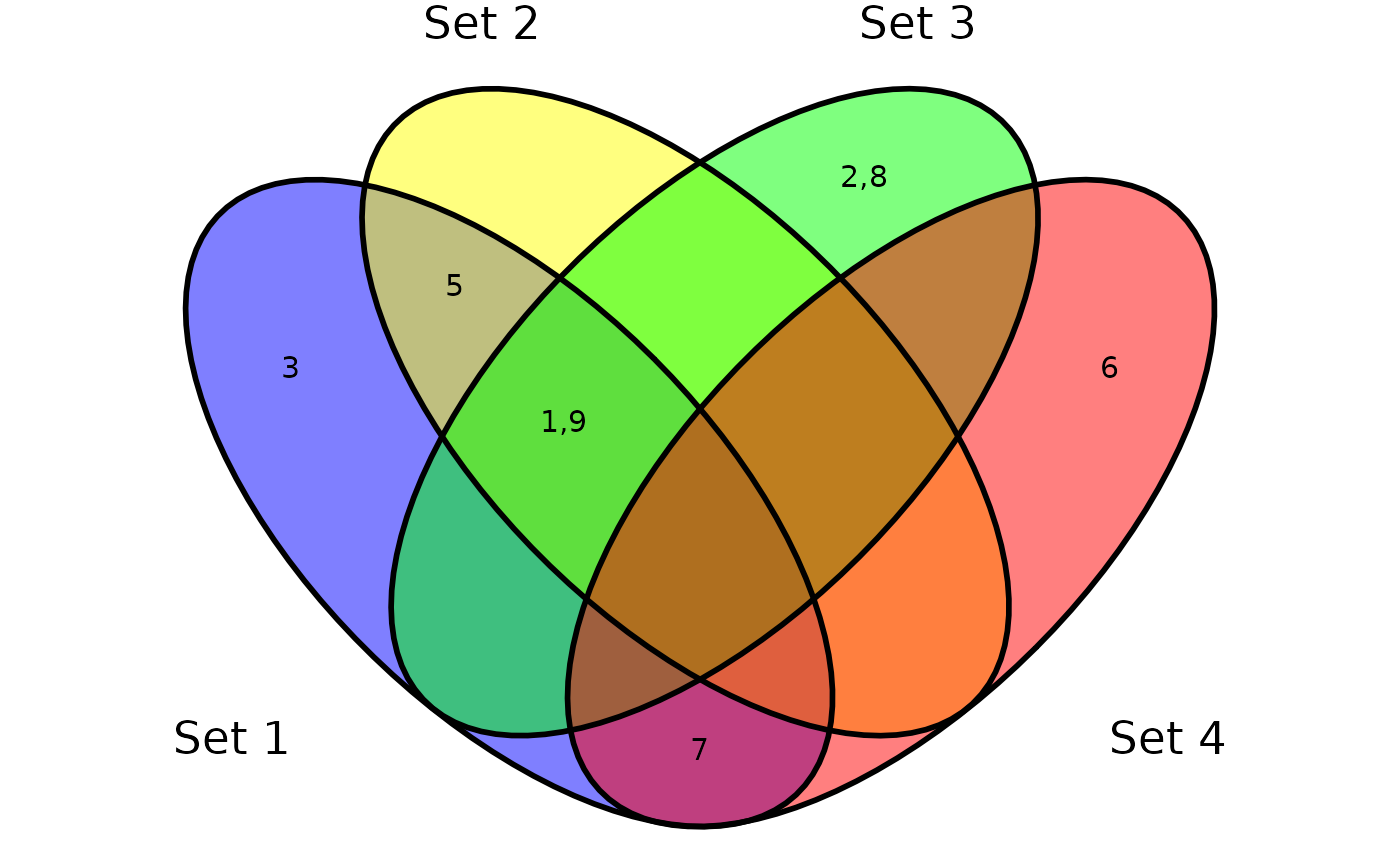
 ggvenn(a)
 # use data.frame as input
d <- dplyr::tibble(value = c(1, 2, 3, 5, 6, 7, 8, 9),
`Set 1` = c(TRUE, FALSE, TRUE, TRUE, FALSE, TRUE, FALSE, TRUE),
`Set 2` = c(TRUE, FALSE, FALSE, TRUE, FALSE, FALSE, FALSE, TRUE),
`Set 3` = c(TRUE, TRUE, FALSE, FALSE, FALSE, FALSE, TRUE, TRUE),
`Set 4` = c(FALSE, FALSE, FALSE, FALSE, TRUE, TRUE, FALSE, FALSE))
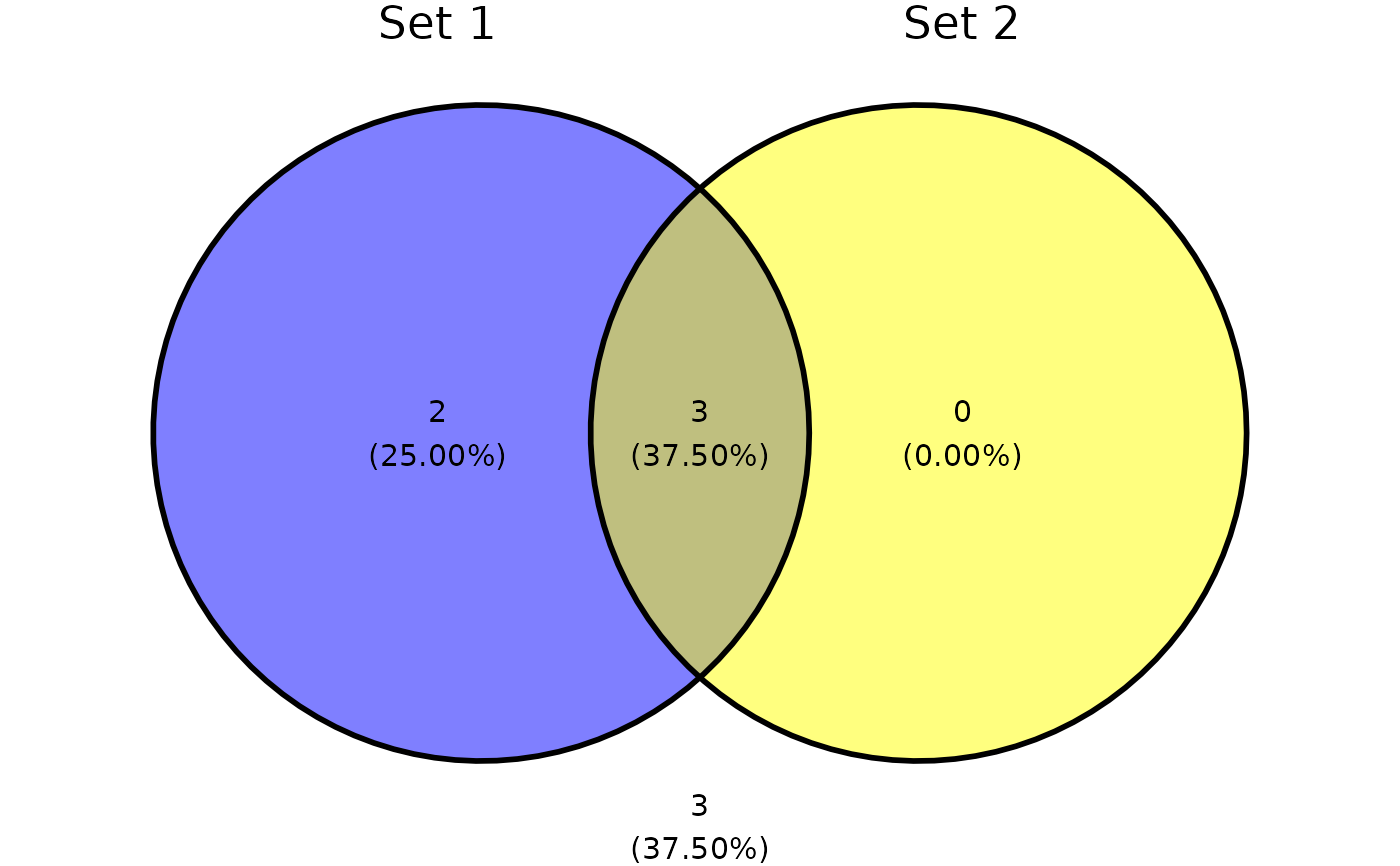
ggvenn(d, c("Set 1", "Set 2"))
# use data.frame as input
d <- dplyr::tibble(value = c(1, 2, 3, 5, 6, 7, 8, 9),
`Set 1` = c(TRUE, FALSE, TRUE, TRUE, FALSE, TRUE, FALSE, TRUE),
`Set 2` = c(TRUE, FALSE, FALSE, TRUE, FALSE, FALSE, FALSE, TRUE),
`Set 3` = c(TRUE, TRUE, FALSE, FALSE, FALSE, FALSE, TRUE, TRUE),
`Set 4` = c(FALSE, FALSE, FALSE, FALSE, TRUE, TRUE, FALSE, FALSE))
ggvenn(d, c("Set 1", "Set 2"))
 ggvenn(d, c("Set 1", "Set 2", "Set 3"))
 ggvenn(d)
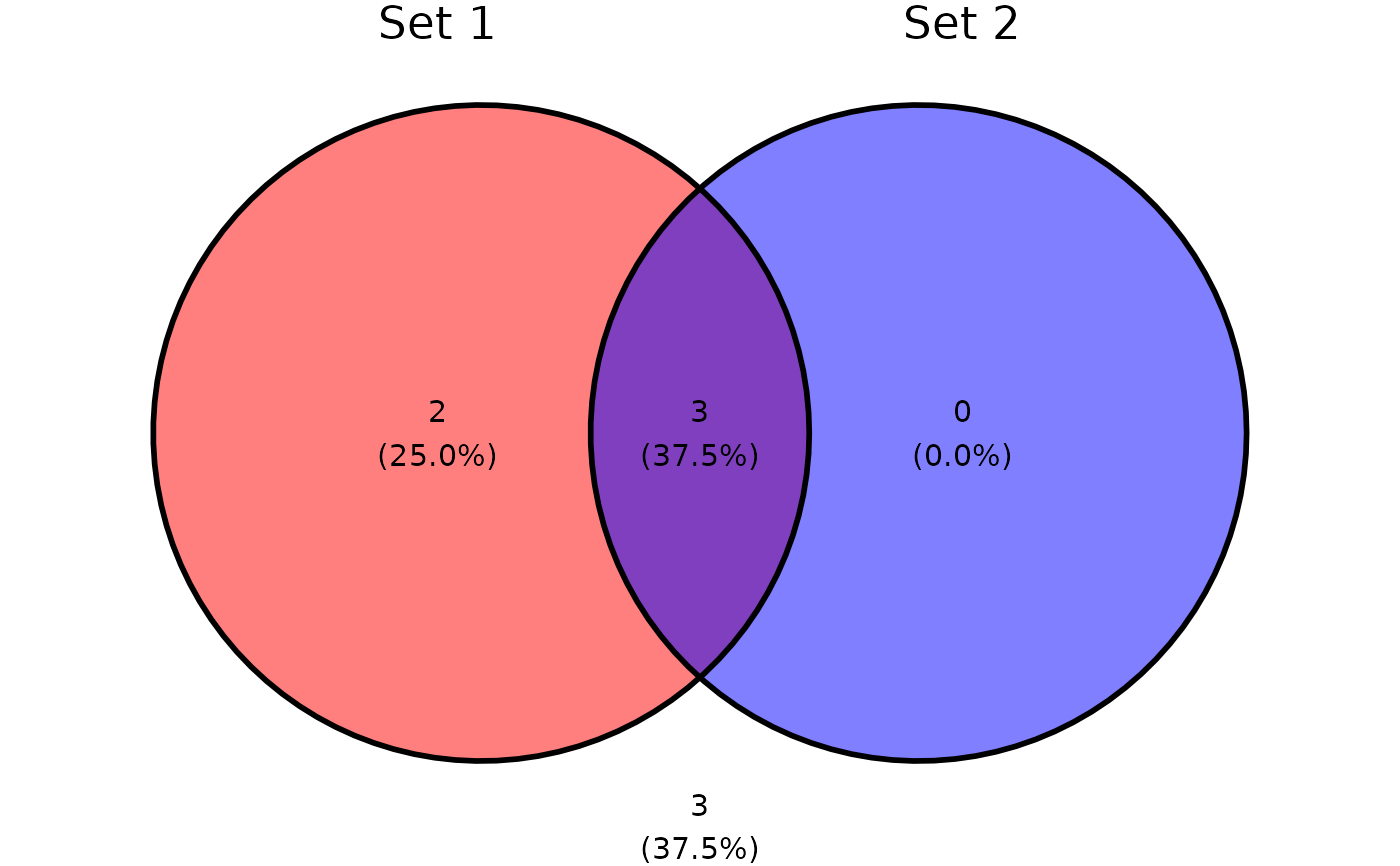
 # set fill color
ggvenn(d, c("Set 1", "Set 2"), fill_color = c("red", "blue"))
# set fill color
ggvenn(d, c("Set 1", "Set 2"), fill_color = c("red", "blue"))
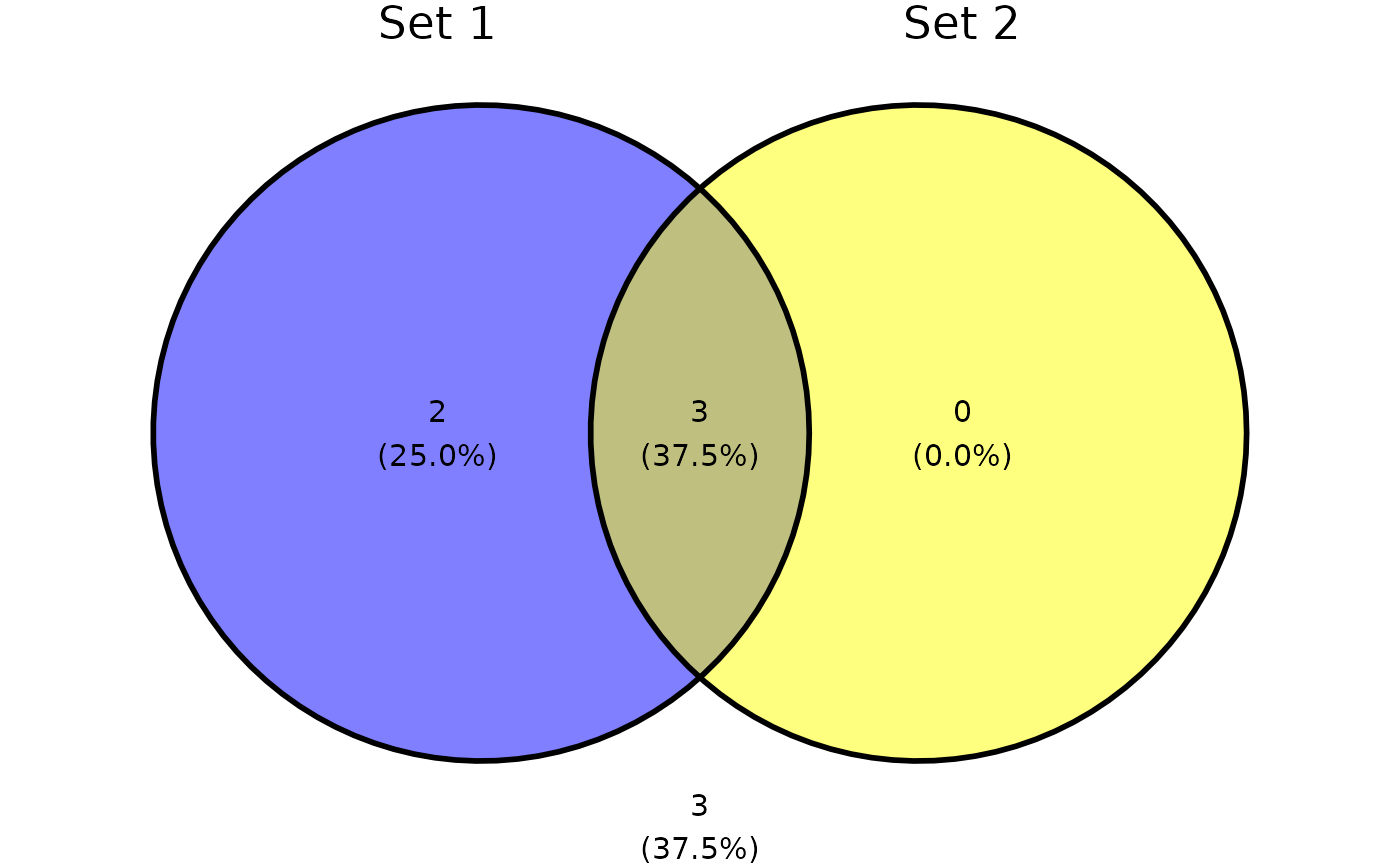
 # hide percentage
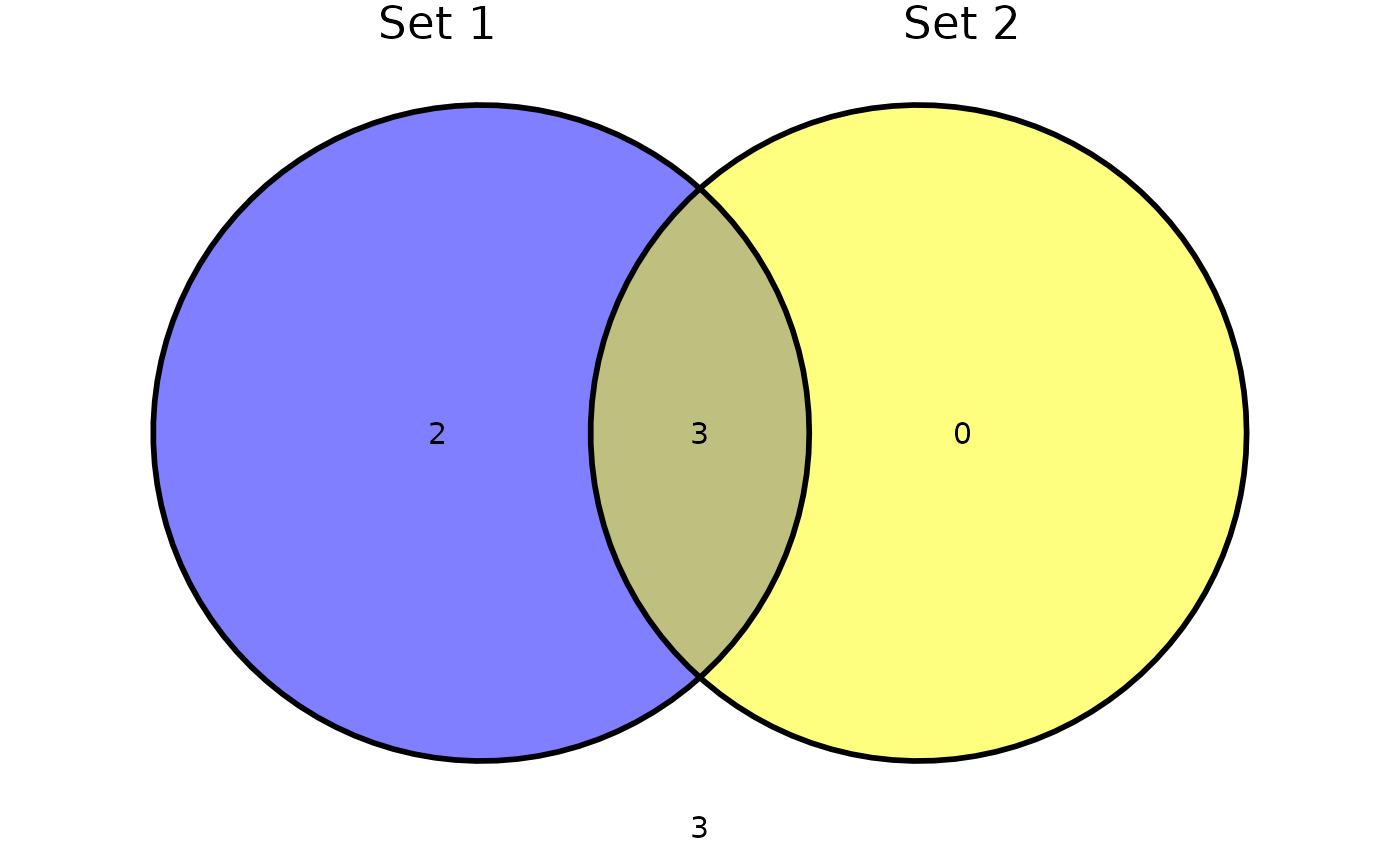
ggvenn(d, c("Set 1", "Set 2"), show_stats = "c")
# hide percentage
ggvenn(d, c("Set 1", "Set 2"), show_stats = "c")
 # change precision of percentages
ggvenn(d, c("Set 1", "Set 2"), digits = 2)
# change precision of percentages
ggvenn(d, c("Set 1", "Set 2"), digits = 2)
 # show elements instead of count/percentage
ggvenn(a, show_elements = TRUE)
# show elements instead of count/percentage
ggvenn(a, show_elements = TRUE)
 ggvenn(d, show_elements = TRUE, element_column = "value")